⚡️ TL;DR
In this post, we explore the importance of estimations in software development and site reliability engineering (SRE). We’ll discuss how accurate estimations can improve project planning, resource allocation, and overall system reliability.
I’ve been asked many times to estimate system capacity or performance requirements. It’s a difficult task, but it’s also a critical one. Estimations are the foundation of capacity planning, and a good back-of-the-envelope calculation can save you from a lot of trouble.
In this post, I’ll share some tips on how to make good estimations. I’ll also show you how to use them to plan your system’s capacity.
Memory
One of the most useful tricks I’ve learned is to use powers of two. This is a simple rule of thumb that can help you make quick estimations. A byte is a sequence of 8 bits, and each bit can have two values: 0 or 1. This means that a byte can represent 2^8 (256) different values. An ASCII character uses one byte of memory so that’s all you need to know to start using powers of two and estimate memory usage.
| Power | Approximation | Name |
|---|---|---|
| 10 | Thousand | Kilobyte (KB) |
| 20 | Million | Megabyte (MB) |
| 30 | Billion | Gigabyte (GB) |
| 40 | Trillion | Terabyte (TB) |
| 50 | Quadrillion | Petabyte (PB) |
Latency
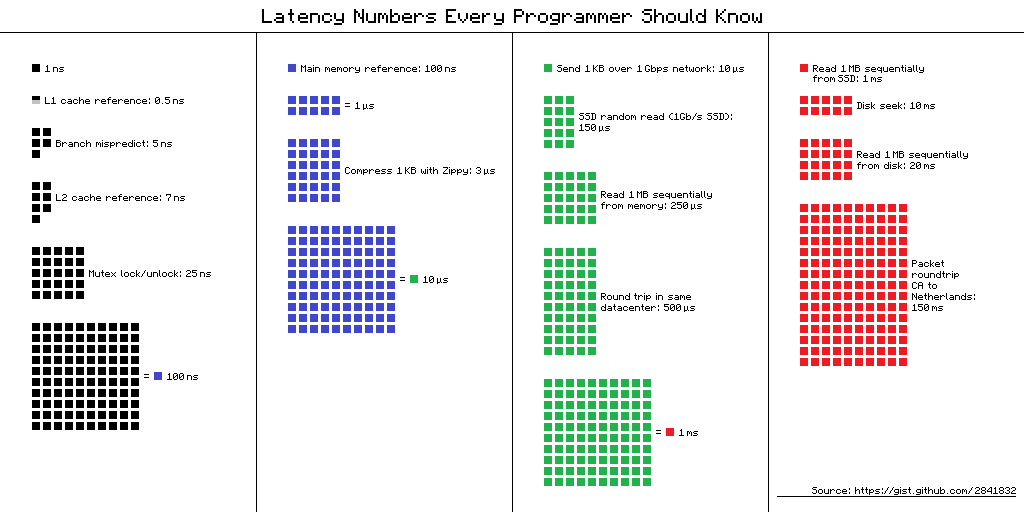
Analyzing latency is a bit more complex than memory. Latency is the time it takes for a request to be processed. It’s usually measured in milliseconds (ms). And it usually depends on the system’s architecture, the network, and the data being processed.
When estimating latency, we should consider that memory is fast but disk is low, simple compression can help reduce latency, and network latency is usually higher than memory latency. Here is a figure that shows the latency of different operations.

Availability
Availability is the probability that a system will be operational at a given time. It’s usually measured as a percentage. For example, 99.9% availability means that the system will be operational 99.9% of the time. When estimating availability, we should consider that the more components a system has, the lower its availability. For example, if a system has three components, each with 99.9% availability, the system’s overall availability will be 99.9% * 99.9% * 99.9% = 99.7%.
A service level agreement (SLA) is a commonly used term for service providers. This is an agreement between the service provider and the cursomer, and this agreement formally defines the level of uptime our service will deliver. Uptime is traditionally measured in nines. The more nines, the better. Let’s see some examples:
| Availability | Downtime per day | Downtime per month | Downtime per year |
|---|---|---|---|
| 99% | 14m 24s | 7h 18m 17s | 3d 15h 39m 29s |
| 99.9% | 1m 26s | 43m 49s | 8h 45m 57s |
| 99.99% | 8s | 4m 23s | 52m 35s |
| 99.999% | 0.8s | 26s | 5m 15s |
| 99.9999% | 0.08s | 2.6s | 31.5s |
Estimations in practice
Let’s see how we can use these estimations in practice. Suppose we have a system and we want to calculate the QPS (queries per second) and the storage requirements. We can use the following formula:
These are some of the assumptions we can make:
- The system will have 1 million users.
- Each user will make 10 requests per day on average.
- 10% of the requests will contain images.
- Each image will have an average size of 1MB.
- Data is stored for 5 years.
We can use these assumptions to calculate the QPS and the storage requirements:
These are just rough estimations, but they can help you get an idea of the system’s capacity requirements. We can use these estimations to plan our system’s capacity and make sure it can handle the expected load. Thanks for reading!